Data
Structure information for useful reporting.
The underlying information needs to be structured consistently so that individual records can become something that can actually be analysed and understood.
Data ModellingOperational DataReporting
Spottr
Featured Solution
Spottr was built around a focused product problem: take a process that required too much searching, switching and manual effort, and turn it into something clearer and easier to use.
The challenge
A workflow that needed a more focused digital experience.
The approach
Reduce friction, structure the experience and make the important information easier to work with.
The goal
Build a product experience that feels intentional rather than simply functional.
The project
Spottr started with a simple observation: when a workflow becomes difficult to navigate, the technology around it can become part of the problem.
The project focused on turning that complexity into a more deliberate experience — one where the important information could be found, understood and acted on without unnecessary friction.
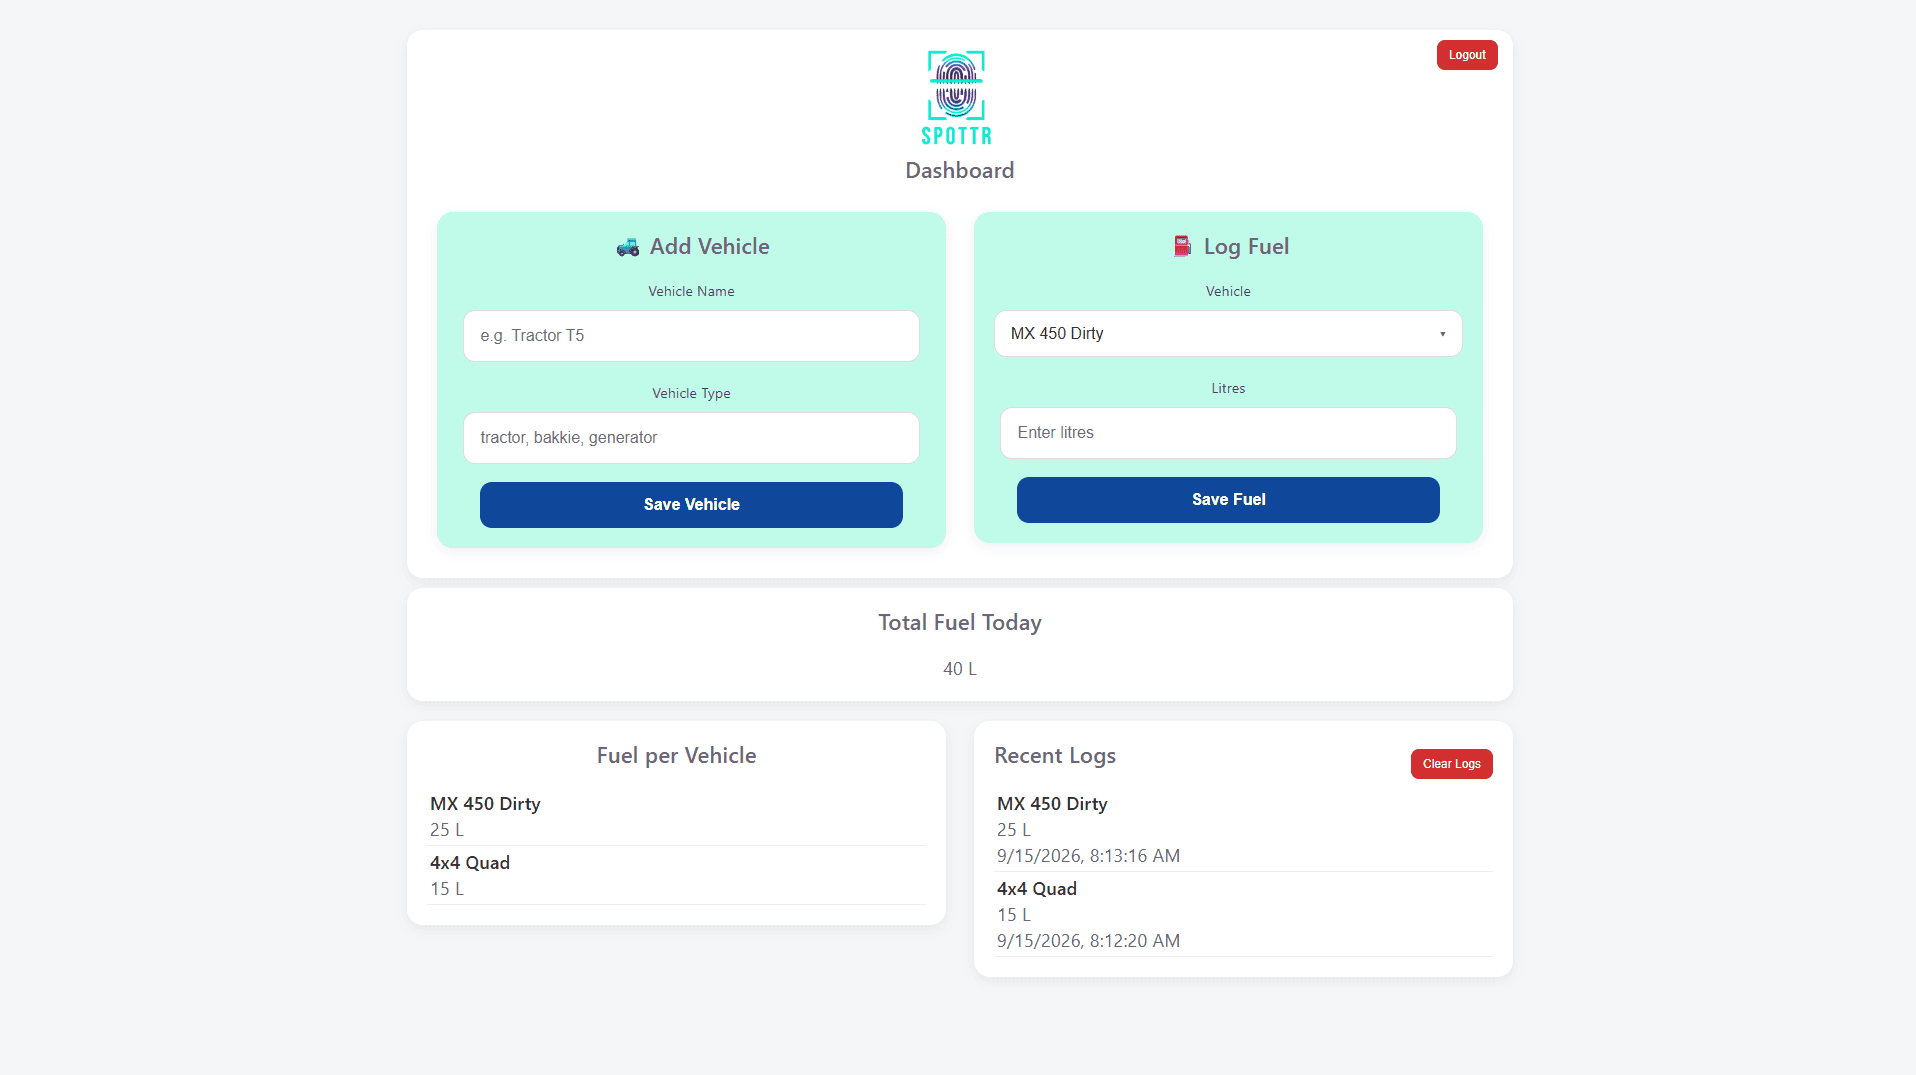
Product interface
The Problem
Fuel activity can generate a lot of useful information, but raw records don't always make that information easy to understand.
Usage needs to be captured consistently, patterns need to be visible, and unusual activity needs to be easier to identify. Without a clear view, the data can become another collection of numbers rather than something that supports day-to-day decisions.
The challenge wasn't simply recording fuel.
It was turning the data into something useful.
The Approach
Instead of treating fuel information as a collection of individual records, I approached Spottr as a product for understanding what was happening across the operation.
The focus was on creating a clear visual overview, structuring the underlying information and making the important parts of the data easier to identify.
Give fuel activity enough structure that it can be understood rather than simply recorded.
Turn raw information into a clearer operational view of usage and activity.
Make the information useful without making the interface unnecessarily complicated.
The Product
Spottr brings the information together into a focused dashboard designed to make fuel activity easier to see, understand and work with.
Visibility
Bring the important fuel information into a single view instead of relying on disconnected records.
Data
Structure operational information so that it can support useful reporting and analysis.
Experience
Keep the interface focused on the information people actually need to understand the operation.
Engineering
Spottr required more than presenting information on a screen. The application needed a structured way to capture, store and surface operational data while keeping the experience straightforward for the people using it.
I worked across the application to connect the underlying data with the experience presented to the user.
Data
The underlying information needs to be structured consistently so that individual records can become something that can actually be analysed and understood.
Application
The dashboard and application experience were built around the information users need to work with, rather than treating the interface as a separate layer from the underlying system.
Visibility
Data becomes more useful when the interface helps people recognise patterns, understand activity and focus on the information that matters.
Product Thinking
The technical decisions were made with the product experience in mind — keeping the system useful without introducing unnecessary complexity.
The goal wasn't to build another dashboard.
It was to make the data useful.
Outcome
Spottr brought the underlying information into a more focused product experience, giving users a clearer view of fuel activity rather than leaving the data buried in individual records.
More importantly, the project reinforced something I see repeatedly in software: the value isn't necessarily in the amount of technology involved. It's in how effectively that technology helps someone understand and solve a real problem.
Good software makes complexity easier to work with.